Ogma, the all-in-one javascript
library for large-scale interactive
graph visualizations
Discover the ins & outs of Ogma

Ogma is a Javascript library for large-scale interactive graph visualizations. Its graphical engine is built for WebGL first. It also supports HTML5 Canvas and SVG with the same level of details. Ogma offers set of features required to display, explore, and interact with graph data in a web application. This includes connecting to various sources to import and export data, smart layouts algorithms, rich user interactions, and fully customizable visual styles.

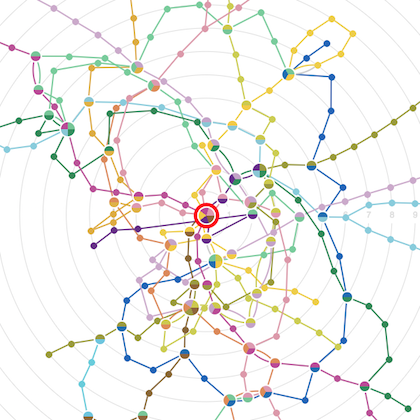
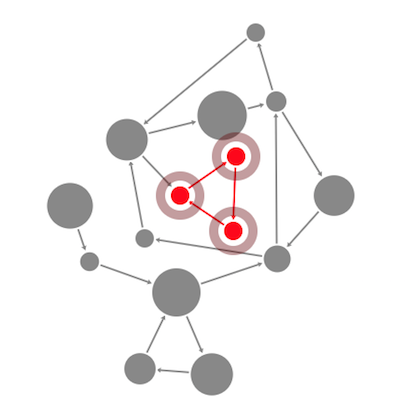
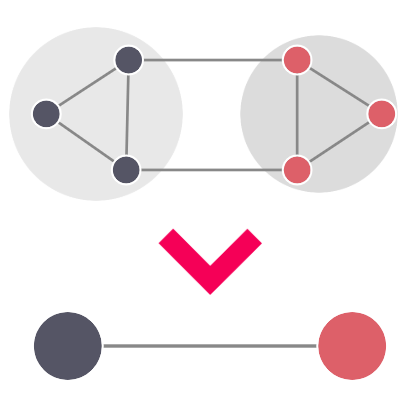
You can develop rich applications using graph data visualisations with Ogma. Adding custom UI on top of Ogma is easy as it integrates with all the popular front end frameworks. You can use dynamic styles for your data similarly to CSS, and react to the changes in data and graph topology, finding and emphasizing individual patterns and structures. You can visualize large networks using state-of-the-art graph layout algorithms and leverage the power of rule-based transformations that helps you clear the view and extract insights from your data.

See more

Features

Graph layouts

Use different kinds of layouts to gain insight into your data and emphasize the structure in it. The state of the art layout algorithms of Ogma are your first step in creating visualisations.

Analysis

Use graph analysis tools and algorithms: shortest path, cycle detection, connectivity.

Transformations

Transformations are Ogma's tools to dynamically adapt how the data is displayed to your needs by filtering, grouping nodes and edges and turning attributes into entities

Annotation layers

Annotation layers are a way to add information to the graph, such as tooltips or additional shapes to describe and explain your workflows and to enrich your visualisation. It can also be used to add new visual features to nodes and edges of the graph.

Geo mode

Geographical mode allows you to display the graph on top of a map, giving you a new perspective on your data. Ogma can integrate with different map services and display additional annotation layers

Node styling

Apply styling to your nodes to express their meaning using a full palette of colors, borders, icons, badges and text labels

Edge styling

Edges can be styled too so that you can make sense of the links in your data

Graph editing

You can create and edit data using Ogma, adding new links and nodes, reconnecting the points in your data and giving it new meaning.

Interactions

Move and re-arrange the nodes and links, select and expand the items to highlight and investigate the connections and patterns.

Playground

Open in the playground