
Appearance
Ogma is a commercial JavaScript library that can be leveraged to develop powerful, large-scale interactive graph visualizations. Ogma comes equipped with everything you need to easily visualize and analyze your graph data and increase your productivity across the board.
Ogma’s unrivalled graph layout performance unlocks interactive large graph visualizations within your application, so you can grasp the full context of complex systems. Visualize tens of thousands of nodes almost instantly while preserving precision and quality, even with a
Run algorithms server-side!
Ogma’s graph layout algorithms draw clear structures out of large and densely connected data, revealing hidden patterns to your end users.
See exampleRearrange nodes, expand clusters, and highlight connections to investigate relationships with ease and precision. Load data interactively for progressive exploration of connections or temporal monitoring.
See exampleOverlay graphs on maps to add geospatial context, or add custom overlays for indoor mapping or system engineering. Integrate with any vector/tiles mapping services. Cluster nodes by zoom level to simplify visualizations.
See exampleRefine data with fast filtering on nodes and edges based on single or multiple conditions on specific data attributes. Filter temporal networks and see their evolution with an interactive timeline.
See exampleEmpower your users to simplify or adapt their visualizations interactively by grouping, clustering nodes, or reshaping graph structures with dynamic transforms to enable different levels of abstraction.
See example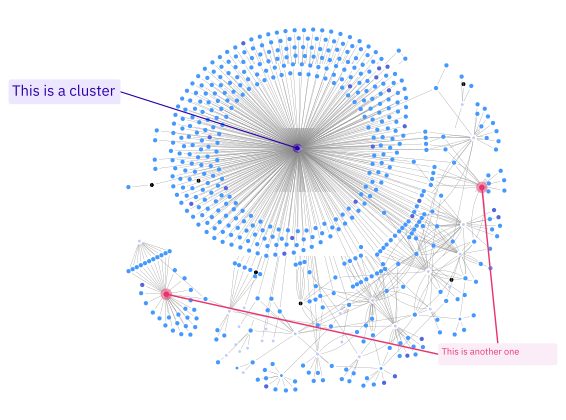
Instead of editing pictures in PowerPoint, empower users to comment, highlight key data points and draw areas directly within graph visualizations.
See exampleCustomize all visual styles to fit your business needs and create clear and memorable visualizations. Define nodes and edges with colors, borders, icons, badges, and labels to convey meaning instantly.
See exampleExport data in Excel or graph formats, and slick images in PNG, SVG, or PDF. Preserve custom styles, annotations, and layouts for seamless sharing, reporting, or documentation.
See exampleWhether you’re just beginning with Ogma or diving into more advanced features, Ogma provides all the tools and resources you need to succeed. From 100+ ready-made examples and step-by-step tutorials to expert developer support, we’re here to guide you every step of the way to accelerate your project.
The Ogma live-coding playground lets you quickly kickstart projects, test ideas, and share your code easily. Create and edit graph visualizations directly in your browser, then instantly share your code and results with colleagues via a simple link.
When you're ready, implement your ideas within your application. Ogma integrates into your JavaScript framework. Load data via API, JSON, CSV, or built-in connectors—no graph database required. Get started with tutorials, templates, and framework examples, or reach out to us if yours isn't listed!
After integrating Ogma and displaying your first graph, customize it with styles, interactions, and advanced analytics. Explore examples, speed up development with tutorials and templates, and optimize performance with expert guidelines.
“What made the difference for us in choosing Ogma was the higher-level abstract, programmatic API that came out-of-the-box along with the responsiveness of the support and technical team which was a huge win.”
With advanced graph technology like Ogma, engineers at Volvo Cars have introduced a new culture of innovation.
Cerved’s Innovation team developed Graph4You, a graph-based visualization application that would allow their clients to better understand financial ecosystems with a more dynamic way of accessing and exploiting the connected data within them
The Purpose Innovations team at Cisco is tasked with how to innovate around technologies to help drive purpose throughout the organization. So when Cisco looked for a breakthrough way to visualize the dynamics of their teams and organization at large, they chose Ogma, Linkurious’ graph visualization library.
To achieve greater software intelligence, CAST needed a solution that could handle the complexities of today's modern software systems in terms of both volume and performance.
The Sentry launched Atlas, a public-facing, interactive open data tool to shine a light on networks of corruption, built with Ogma.