Appearance
Plugins
Ogma provides a set of plugins that extend its functionality and allow you to customize the graph visualization. These plugins can be used to add features such as annotations, timeline, cards, mini-map, and more.
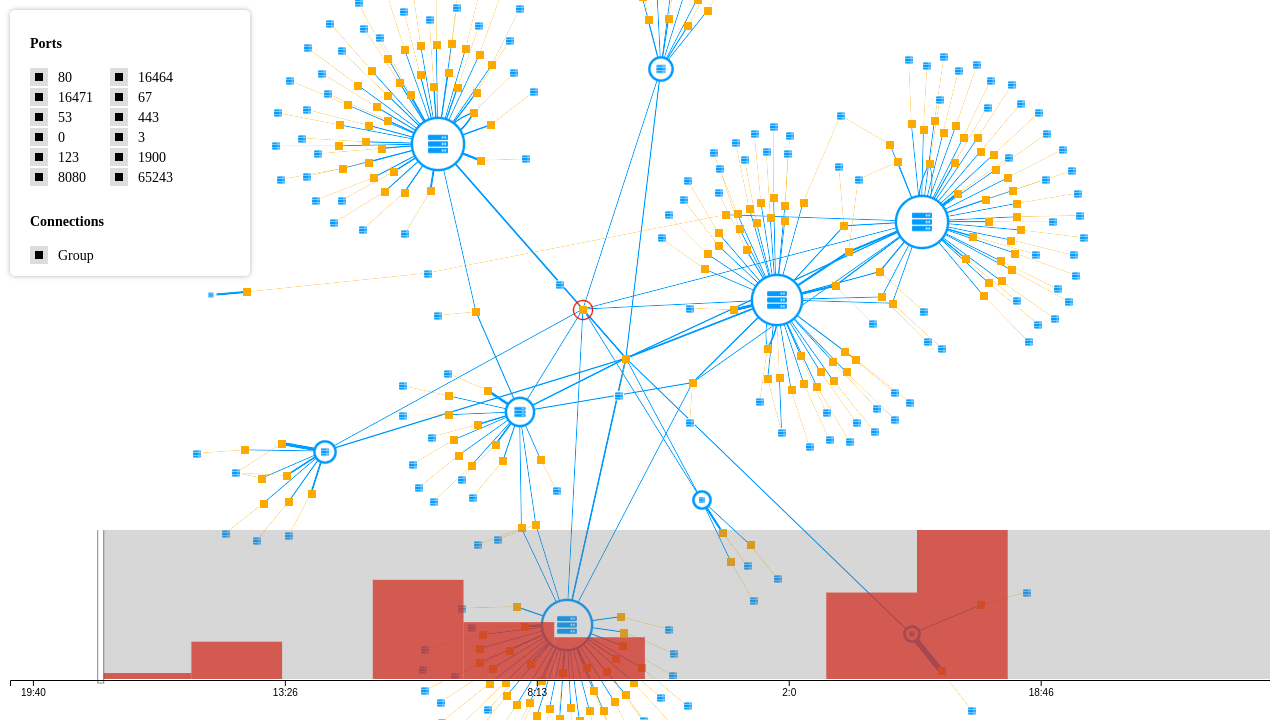
Timeline
The Timeline plugin allows you to visualize the temporal aspect of your graph data. It provides a timeline view that can be used to display events, changes and lifespans of your nodes and edges.
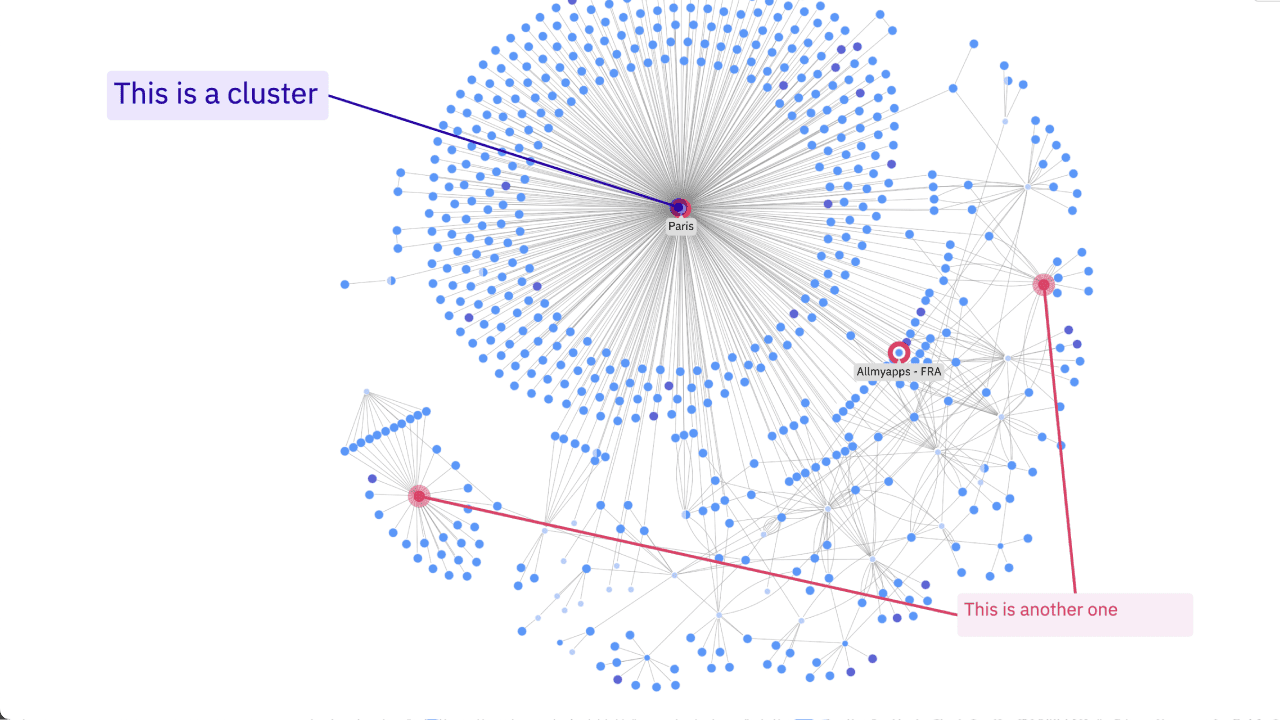
Annotations
Annotations plugin provides an API to add custom annotations to the graph. It takes care of the complex interactions of positioning, resizing, creating, and deleting annotations.
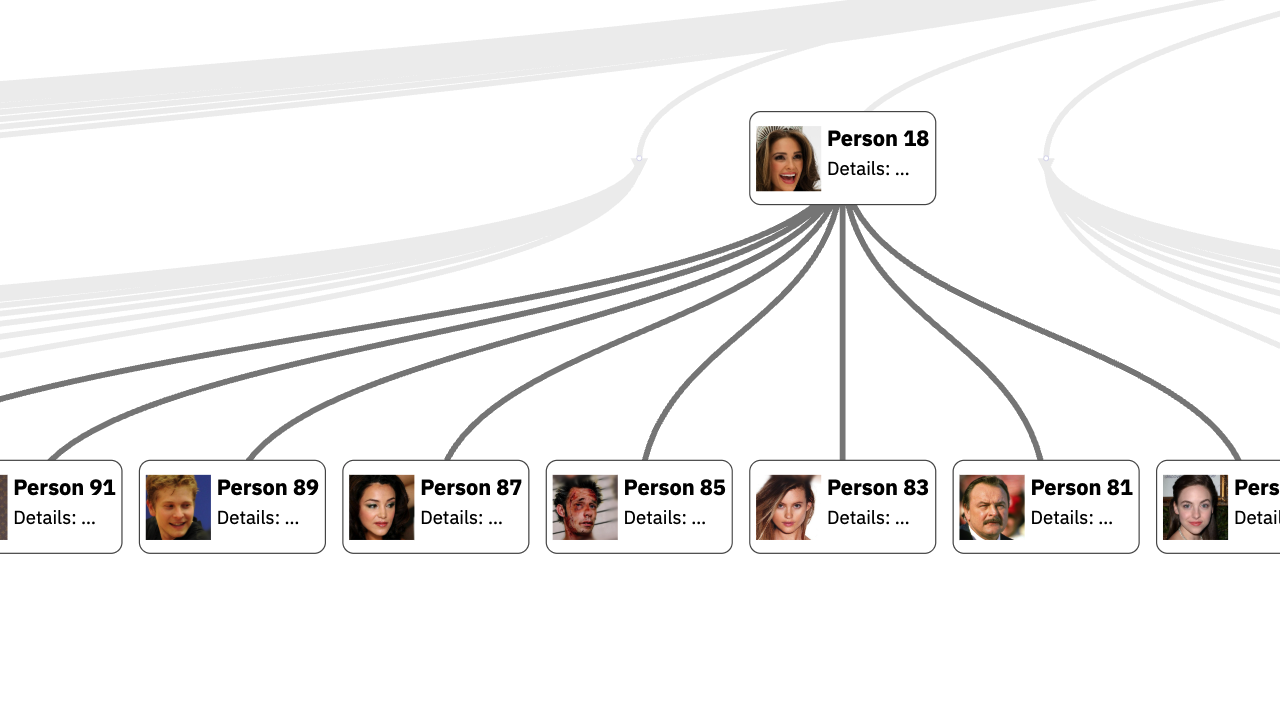
Cards
This plugin allows you to display additional information about nodes and edges in a card format. It can be used to show details such as node properties, edge weights, or any other relevant information.