
Filters: Timeline
The Timeline places the nodes and edges of the visualization in time, and hides the ones outside the period you choose.
It is available when the administrator has set at least one property as a Date or Datetime property in the schema. Open it with the clock button in the upper right corner of the workspace. While the Timeline hides nodes or edges, the button shows a dot.
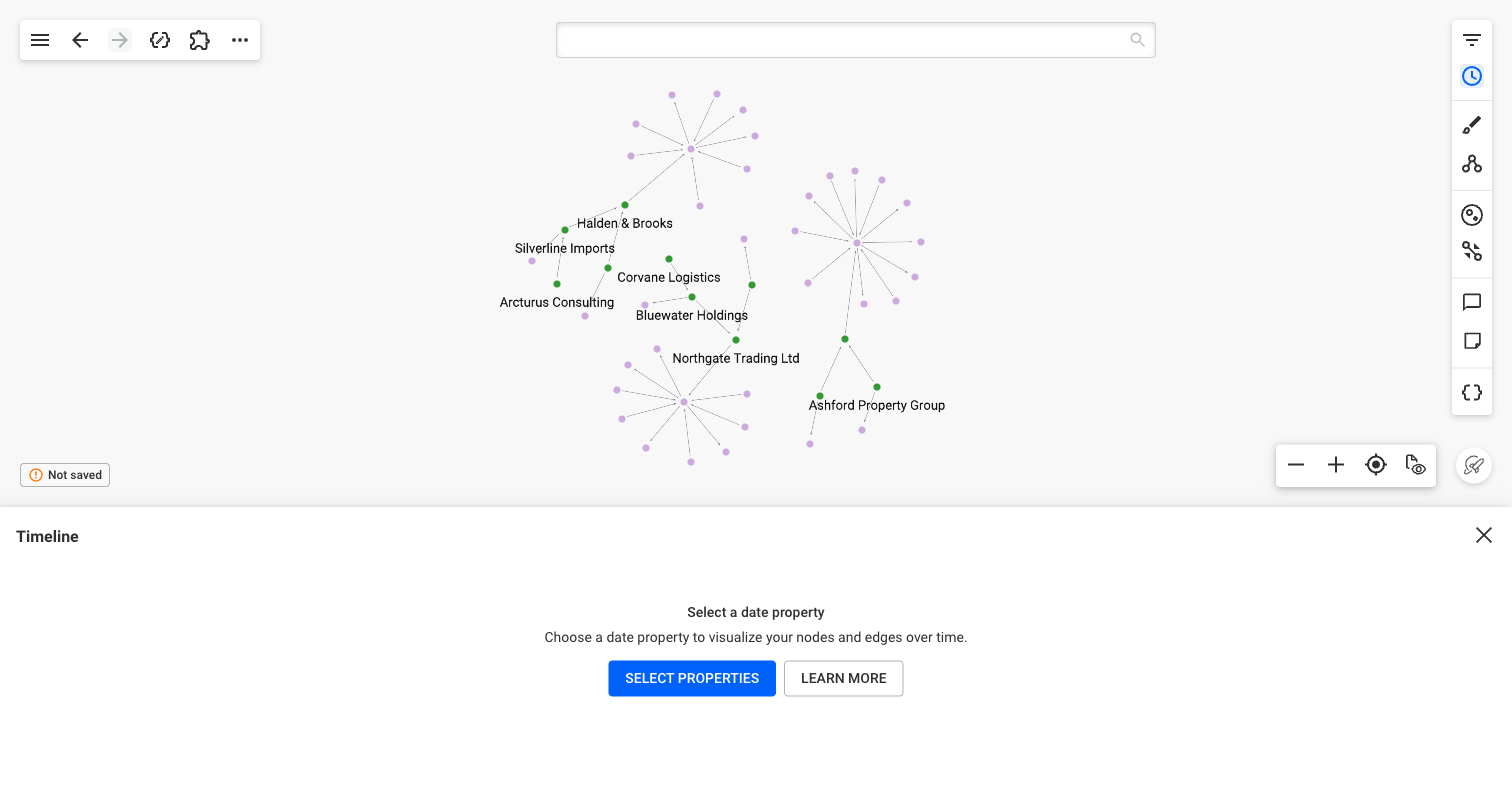 The examples on this page show three companies with their shareholders, their bank accounts, and the transfers between those accounts.
If no node or edge of the visualization has a date property, the panel says so. Add nodes or edges that have date properties to the visualization, or ask an administrator to set date properties in the data schema. Administrators can open the data schema from the panel.
Select properties
Click "Select properties", or "Modify selection" once the Timeline shows a chart. For each node category or edge type, choose a date type:
- "Single date": one property places the node or edge in time, like the date of a transfer.
- "Date range": a start property and an end property, like the opening and closing dates of a bank account. A date range with no end runs until today.
Single dates
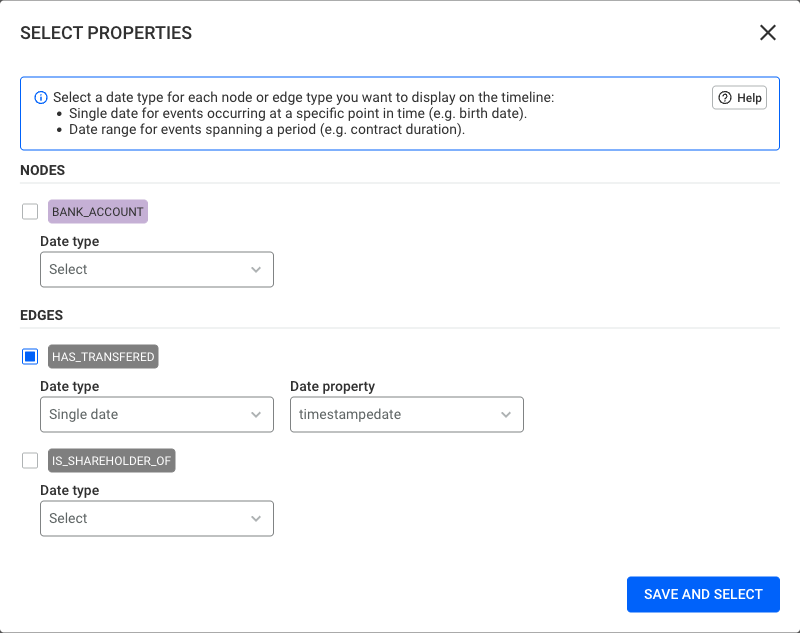 Here, HAS_TRANSFERED is selected with a single date: the date and time of each transfer.
Each bar counts the nodes and edges whose date falls in it. To hide the ones outside a period, drag the handles of the chart, or type dates in the From and To fields. Clear a field to remove its bound.
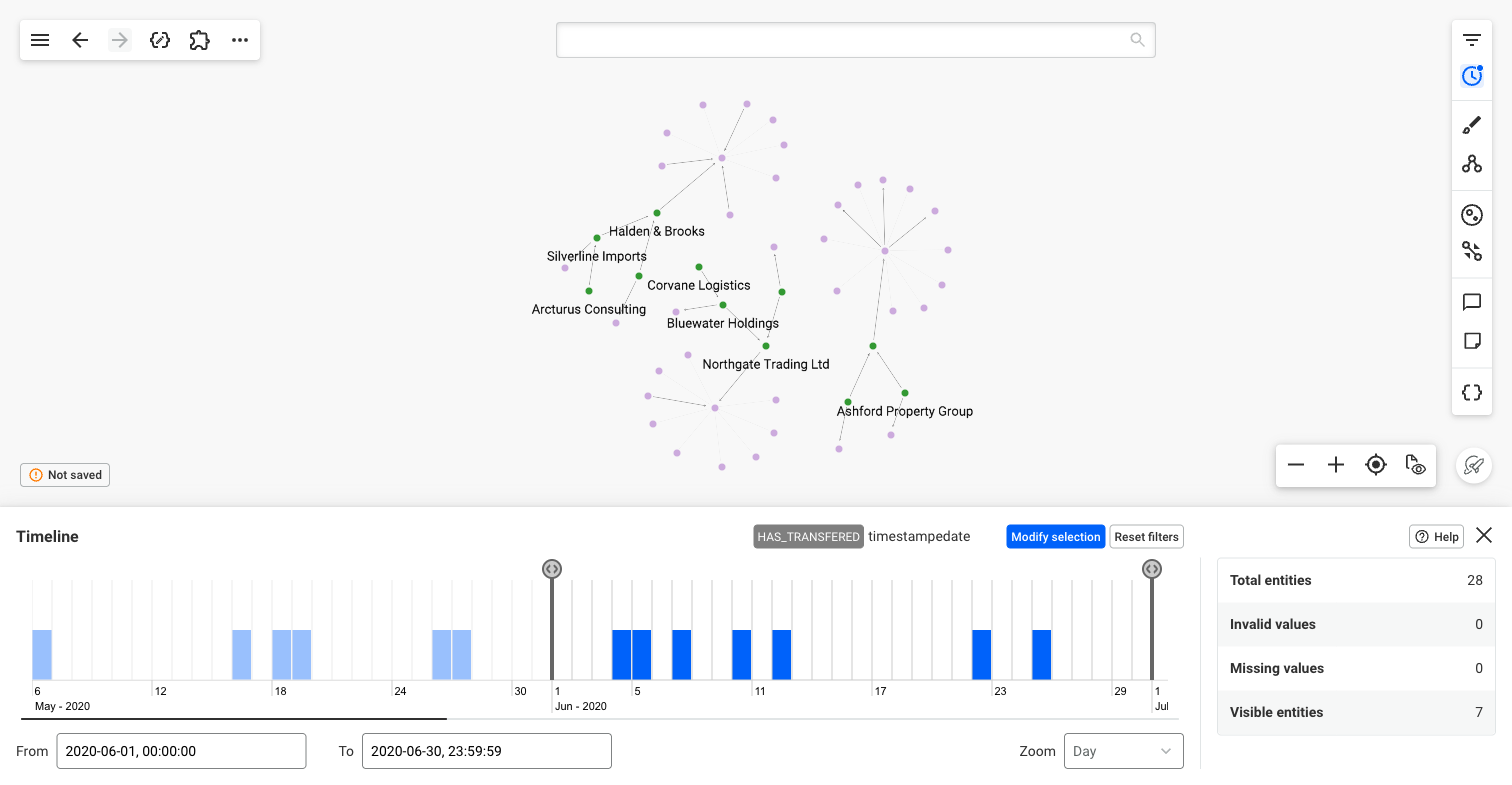 The chart shows 28 transfers between May and August 2020. With From and To set to June, only the 7 transfers of that month stay visible, and the others fade in the graph.
Date ranges
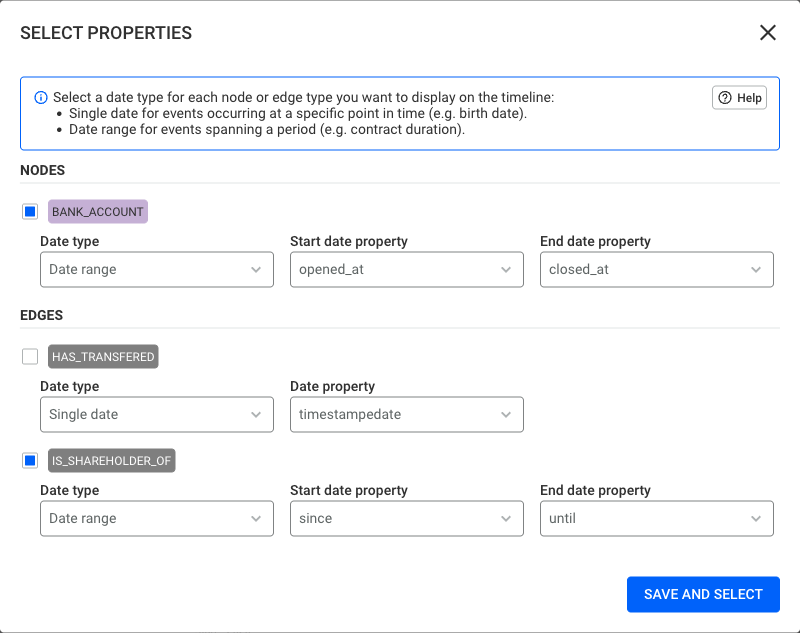 Here, BANK_ACCOUNT is selected with a date range, from the opening to the closing of each account, and IS_SHAREHOLDER_OF from the start to the end of each shareholding.
Each bar counts the nodes and edges that exist during its period. A period set with the handles or the From and To fields keeps the ones that exist at some point within it.
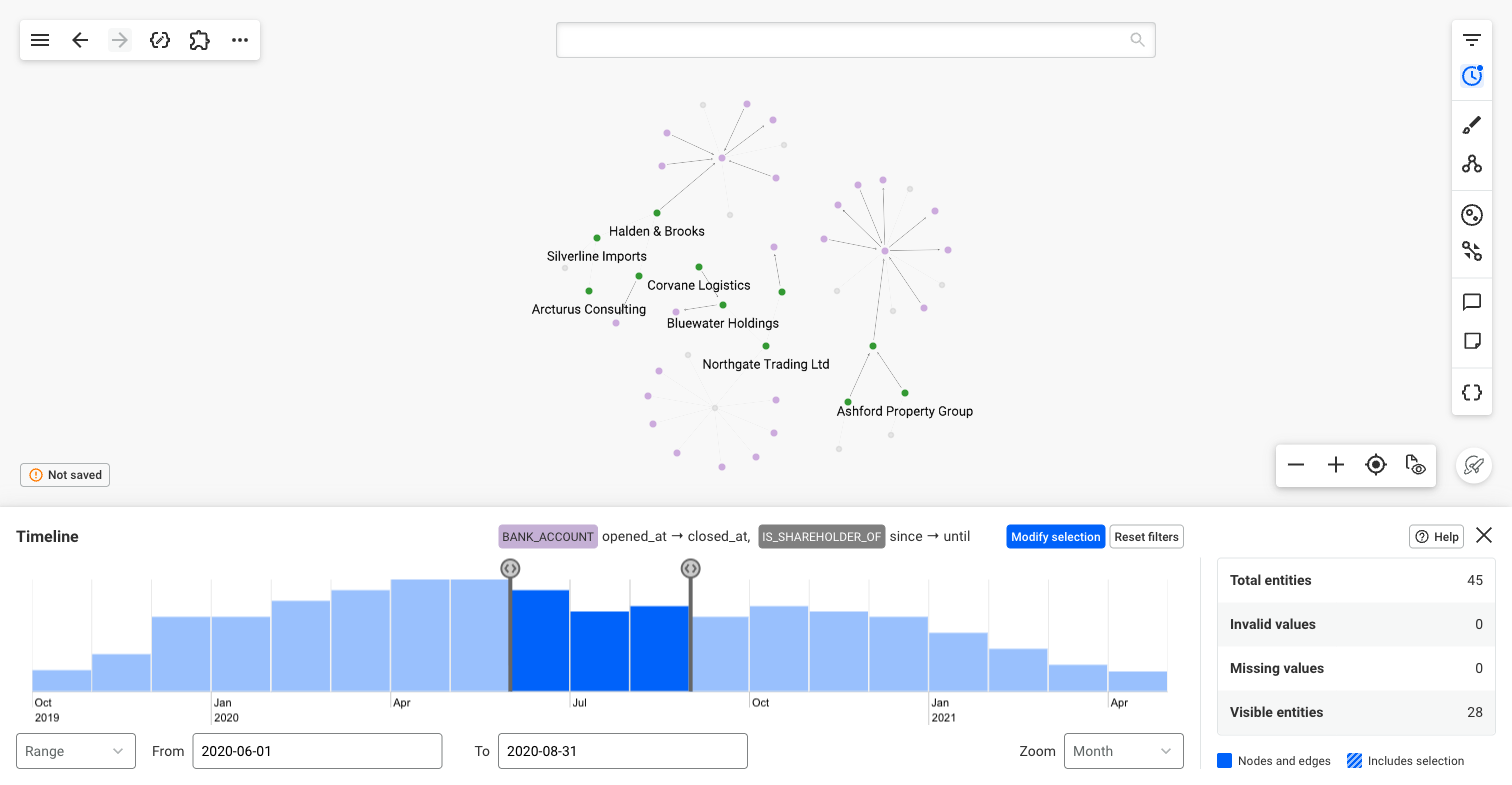 Each bar counts the accounts open and the shareholdings held during its month. With From and To set from June to August 2020, 28 of them stay visible: the ones that existed at some point in that period.
As at
With a date range, the mode switches from "Range" to "As at". "As at" keeps only the nodes and edges that exist on one date. Nodes and edges placed in time by a single date are not hidden in "As at".
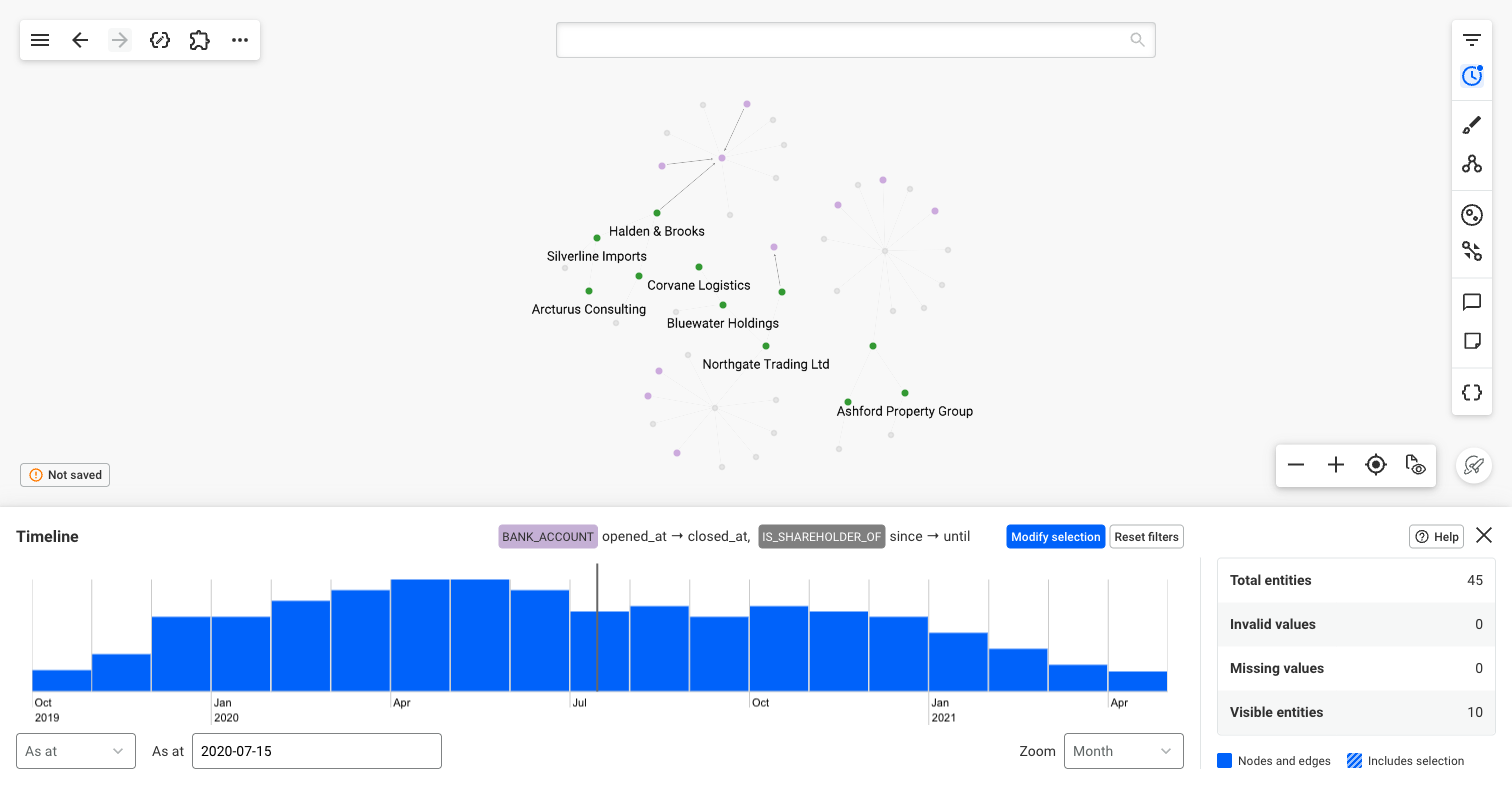 On 15 July 2020, 10 accounts and shareholdings existed. They are the only ones left visible.
Each node and edge on its own row
Zoom in far enough, and the chart shows each node and edge on its own row instead of bars: a bar for a date range, and a point for a single date. They are grouped by node category and edge type, listed with their count in the left column.
Double-click a node or an edge in the graph to show it in the Timeline.
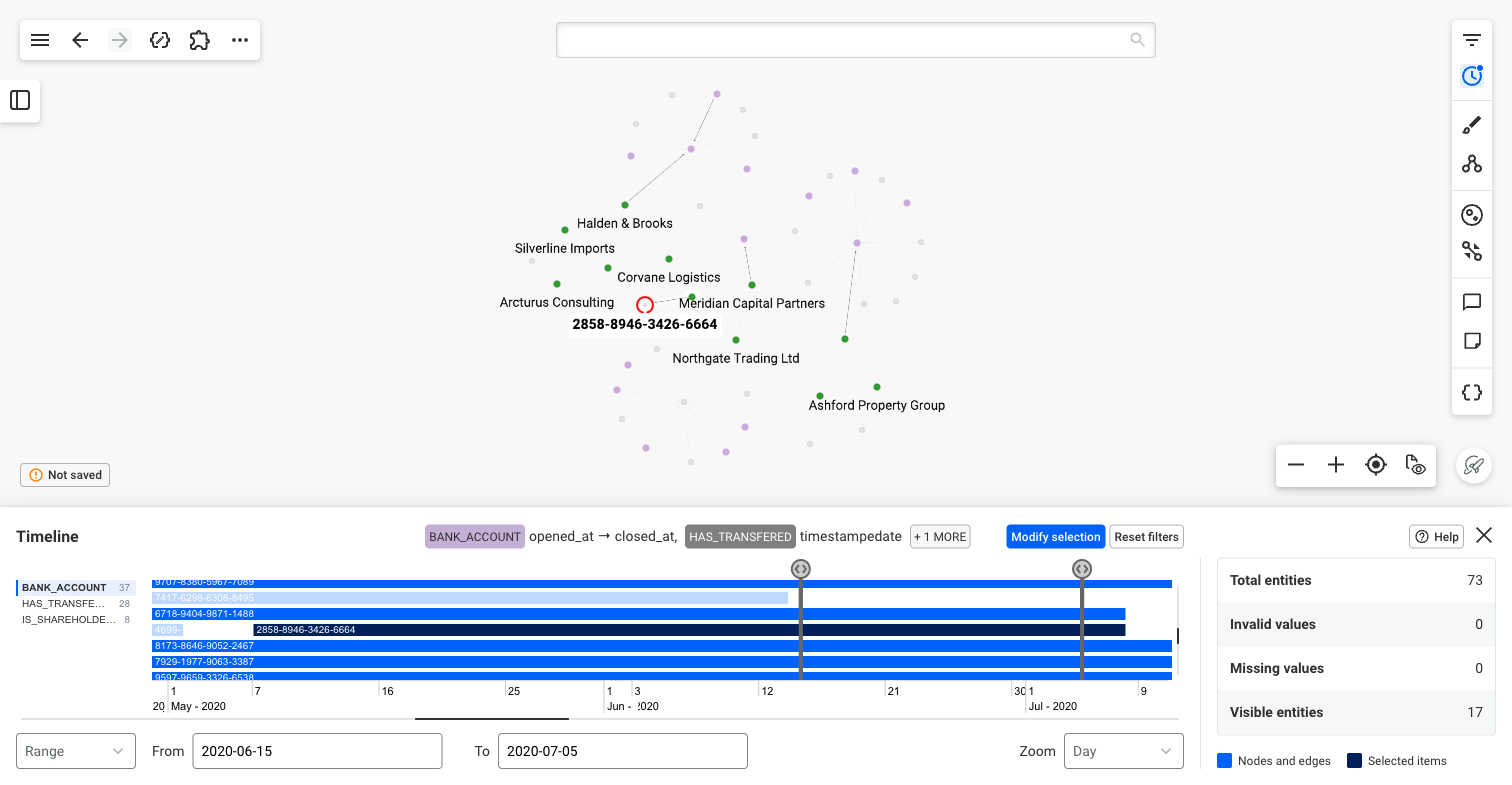 Here, the account 2858-8946-3426-6664 is selected in the graph. Its row shows it open from 7 May to 8 July 2020. With From and To set from 15 June to 5 July, the accounts closed before 15 June are faded, like the one closed on 13 June.
Reading the chart
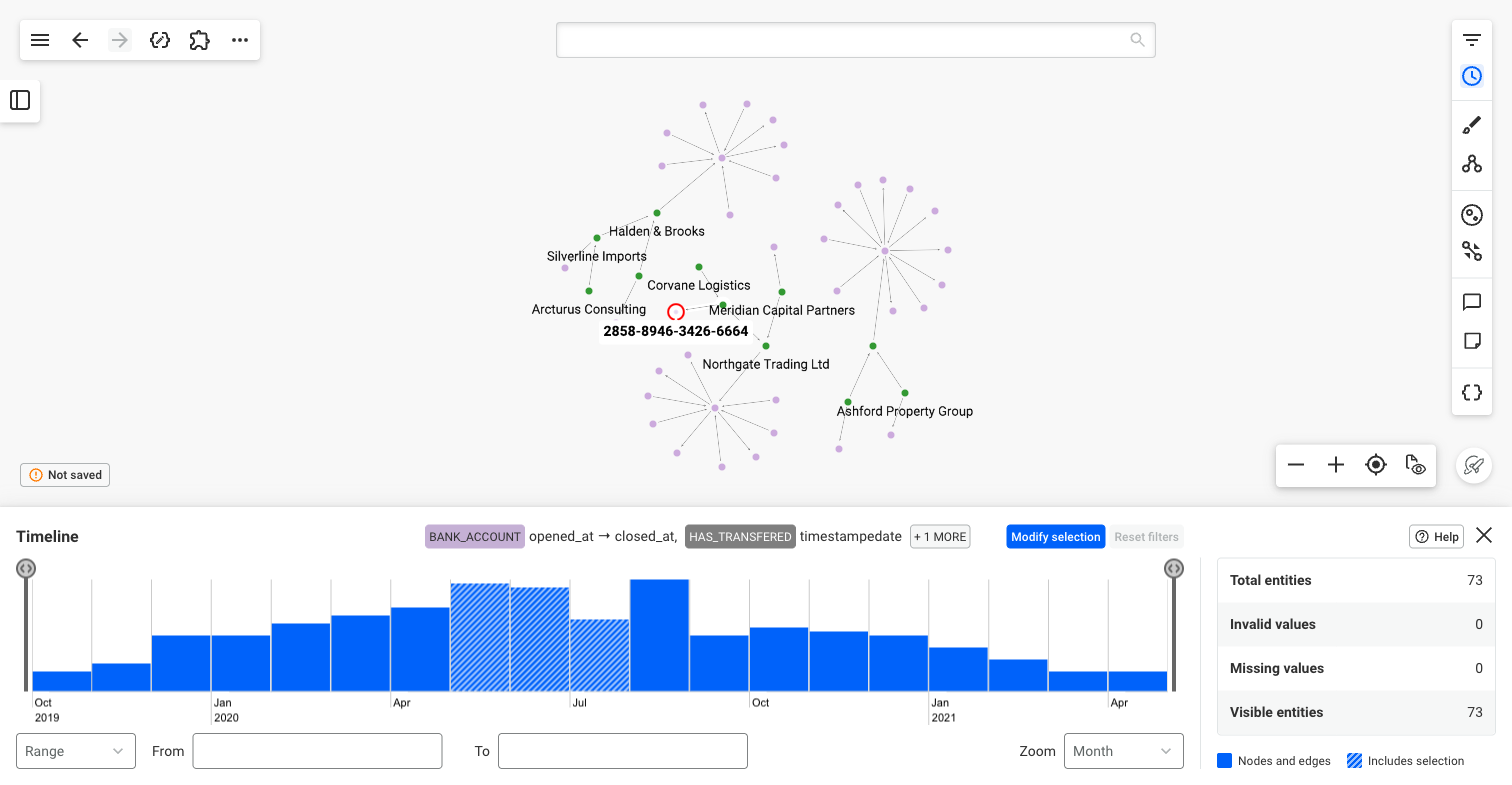 With the same account selected in the graph, the three months it was open, May to July, are striped.
The statistics on the right of the panel give:
- "Total entities": the nodes and edges that hold a valid value for one of the selected properties.
- "Invalid values": the nodes and edges whose value for one of the selected properties is not a date.
- "Missing values": the nodes and edges that have none of the selected properties.
- "Visible entities": the nodes and edges that the Timeline does not hide.
Bars that hold nodes or edges selected in the graph are striped. On rows, the selected nodes and edges are darker. The legend under the statistics recalls it.
The Zoom field sets the period of each bar, from years to seconds. The mouse wheel on the chart zooms too. Hours, minutes and seconds are only offered for Datetime properties.