Appearance
Using Ogma in Jupyter Notebooks
You can use Ogma together with Jupyter Notebooks to create interactive notebooks. This is a great way to explore the Ogma API and to create visualizations of your models.
In order to start off using Ogma in a Jupyter Notebook, you just need to import it as a Javascript library and a block, then load data, styles and behaviours, like layout, transformations or other things that you need.
Dependencies and setting up the cell
Add the following dependencies to your notebook:
python
from IPython.display import HTML, Javascript, display
from string import Template
Now you need to load Ogma and set up the <div> element that will contain the graph. You can do this by using the page function and a simple HTML template:
python
def page(script):
  return HTML(Template('''
  <style>
  #graph-container {
    top: 0; bottom: 0;
    left: 0; right: 0;
    width: 100%;
    height: 400px;
    margin: 0;
    overflow: hidden;
  }
  </style>
  <div id="graph-container"></div>
  <script src="path/to/ogma.js"></script>
  <script>$script</script>
  ''').substitute(script=script))
Note that you will need to change the path to the ogma.js file to the correct one.
Populating your visualization
Now you can load the data and styles that you need. For example, you can create a random graph and color the nodes randomly. You can do this by using the Javascript block and putting the content of one of our examples in it:
python
script = Javascript(
'''
// Create Ogma instance
const ogma = new Ogma({ container: 'graph-container' });

const COLORS = [
  '#161344',
  '#3f1c4c',
  '#632654',
  '#86315b',
  '#a93c63',
  '#cd476a',
  '#f35371',
  'white'
];

ogma.setOptions({ background: 'rgb(113,199,183)' });

// Rule to randomly color the nodes.
// This random function must be deterministic.
ogma.styles.addNodeRule({
  color: n => COLORS[n.getId() % COLORS.length]
});

const pulse_options = {
  number: 5,
  duration: 1700,
  interval: 600,
  startColor: 'inherit',
  endColor: 'rgb(113,199,183)',
  width: 5,
  startRatio: 1,
  endRatio: 5
};

// Generate a random graph
ogma.generate.random({ nodes: 10, edges: 0 })
  .then(graph => ogma.setGraph(graph))
  .then(() => ogma.view.locateGraph());
''')

display(page(script.data))
In a similar way, you can pass the JSON data to the cell, for that you will need to modify the page function to accept a JSON object and then use it in the Javascript block:
python
def vis_with_data(script, data):
  return HTML(Template('''
  <style>
  #graph-container {
    top: 0; bottom: 0;
    left: 0; right: 0;
    width: 100%;
    height: 400px;
    margin: 0;
    overflow: hidden;
  }
  </style>
  <div id="graph-container"></div>
  <!-- use real file location -->
  <script src="path/to/ogma.js"></script>
  <!-- visualisation setup -->
  <script>$script</script>
  <!-- second script to load the data -->
  <script>ogma.setGraph($data).then(() => ogma.view.locateGraph())</script>
  ''').substitute(script=script, data=data))
Note the second script that loads the data.
python
import json
data = {
'nodes': [{
'id': 0,
'attributes': {
'text': 'New node'
}
}]
}
script = Javascript(
'''
const ogma = new Ogma({ container: 'graph-container' });
const COLORS = [
'#161344',
'#3f1c4c',
'#632654',
'#86315b',
'#a93c63',
'#cd476a',
'#f35371',
'white'
];
ogma.setOptions({ background: 'rgb(113,199,183)' });
ogma.styles.addNodeRule({
color: n => COLORS[n.getId() % COLORS.length]
});
''')
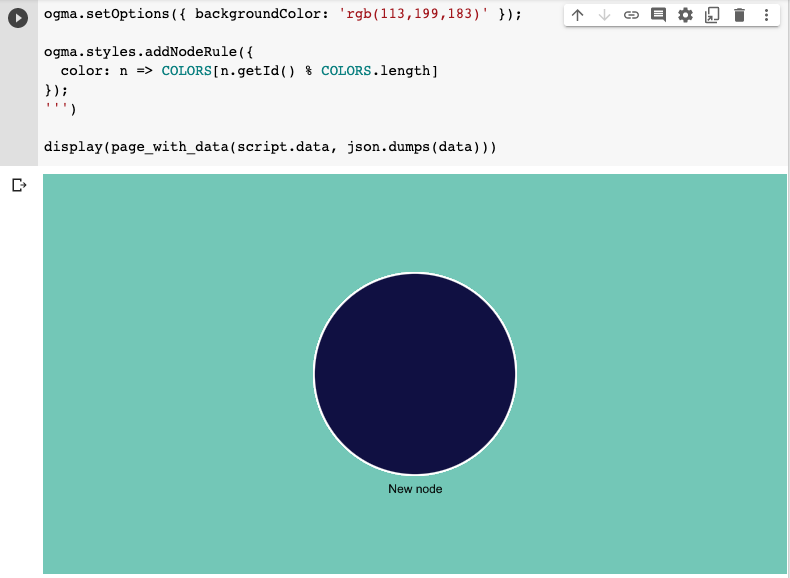
display(vis_with_data(script.data, json.dumps(data)))Now you can see the node that you have just passed to your visualisation cell.